Global E-waste hits new peak in 2014 – US and China account for a third of world total

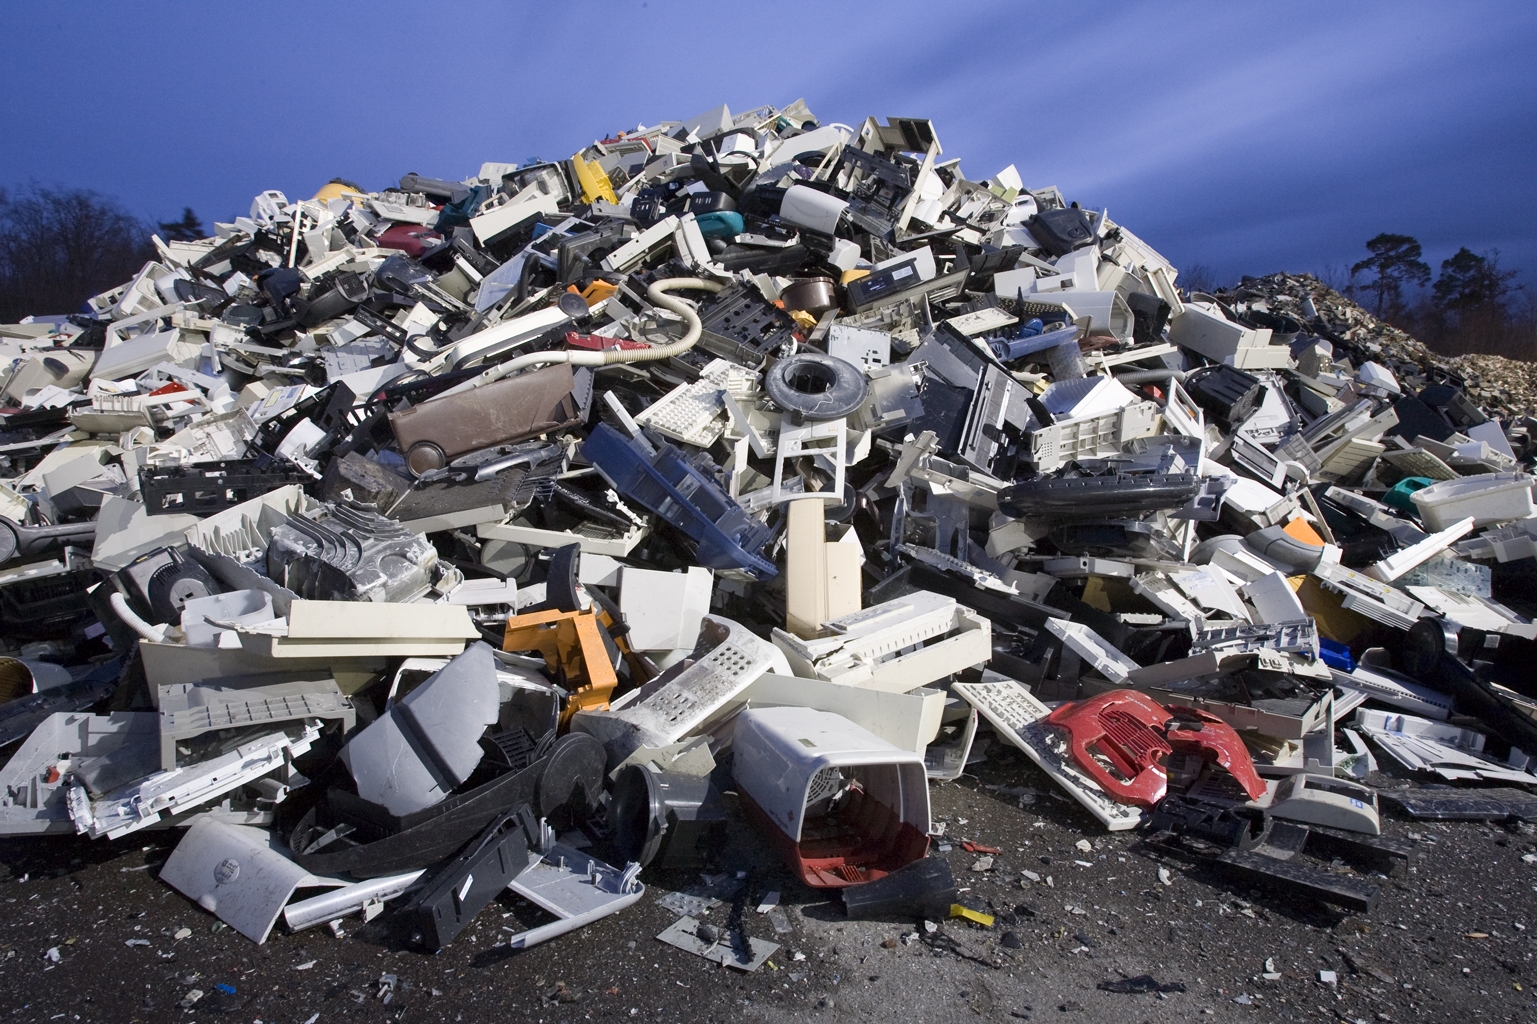
Bonn, April 20, 2015 – In 2014, people worldwide discarded all but a small fraction of an estimated 41.8 million metric tonnes (Mt) of electrical and electronic products according to a new United Nations University report.
And the volume of e-waste is expected to rise by 21% to 50 million Mt in 2018.
According to the report, just two countries — the US and China — discarded nearly one-third of the world’s total e-waste in 2014.
The Global E-waste Monitor 2014: Quantities, Flows and Resources provides an unprecedented level of detail and accuracy about the size of the world’s e-waste challenge, ongoing progress in establishing specialized e-waste collection and treatment systems, and the outlook for the future.
The United States and China generated the most waste. However, countries that regard themselves as environmentally conscious topped the list for per-capita waste, leading with Norway and followed by Switzerland, Iceland, Denmark and Britain.
The bulk of global e-waste in 2014 (almost 60%) was discarded kitchen, laundry, and bathroom equipment. Personal information and communication technology (ICT) devices — such as mobile phones, personal computers, and printers — accounted for 7% of e-waste last year.
This e-waste represented some US$52 billion of potentially reusable resources, yet little of it was collected for recovery, or even treated/disposed of in an environmentally sound manner.
Less than one-sixth is thought to have been properly recycled or made available for reuse.
E-waste last year contained US$52 billion in resources, large volumes of toxic material; most is not collected for recovery or treatment
While e-waste constitutes a valuable “urban mine” — a potential reservoir of recyclable materials — it also includes a “toxic mine” of hazardous substances that must be (but too-seldom are) managed with extreme care.
The UNU report estimates that the e-waste discarded in 2014 contained an some 16,500 kilotons of iron, 1,900 kilotons of copper, and 300 tonnes of gold as well as significant amounts of silver, aluminum, palladium, and other potentially reusable resources, with a combined estimated value of US$52 billion.
It also contained substantial amounts of health-threatening toxins such as mercury, cadmium, chromium, and ozone-depleting chlorofluorocarbons.
Selected highlights:
- In 2014, approximately 4 billion people were covered by national e-waste legislation (though not all laws cover the full range of e-waste and are not all enforced);
- Around 6.5 Mt of e-waste was reported as formally treated by national take-back systems;
- Most world e-waste in 2014 was generated in Asia: 16 Mt (3.7 kg per inhabitant);
- The highest per inhabitant e-waste quantity (15.6 kg/inh.) was generated in Europe; the region (including Russia) generated 11.6 Mt;
- The lowest quantity of e-waste was generated in Oceania (0.6 Mt), however, per inhabitant the e-waste generated was nearly as high as Europe’s (15.2 kg/inh.);
- The lowest amount of e-waste per inhabitant was generated in Africa (1.7 kg/inh). The continent generated 1.9 Mt of e-waste in total;
- The Americas generated 11.7 Mt of e-waste (7.9 Mt in North America, 1.1 Mt in Central America, 2.7 Mt in South America), or an average of 12.2 kg per inhabitant.
The full report is available here. For more about The Global E-Waste Monitor 2014, see here


