Previous Story
Environment at a Glance
Posted On 31 Oct 2015
Comment: 0
Paris, October 26, 2015 – Since 2000, progress is visible in emissions of traditional air pollutants, transport fuel efficiency, energy intensity, renewable energy, water use, sewage treatment, and biodiversity protection.
This is partly explained by the slowdown in economic activity following the economic crisis, but also by increased uptake by OECD countries of instruments to address environmental pressures, including taxation to influence consumer behaviour and internalise environmental costs. Environmental considerations are also increasingly being mainstreamed in development co-operation and in research
and development.
There is substantial scope for strengthening air and climate policies, changing patterns of energy consumption, improving waste and materials management, preserving biodiversity and natural assets, and implementing more integrated policies – all critical components of green growth and sustainable development. Many positive developments still take place at the margin and policies often lack coherence, thus undermining efforts to reduce negative environmental impacts.
Many of these developments still take place at the margin though, and policies often lack coherence, thus undermining efforts to reduce negative environmental impacts. Countries continue to support fossil fuel production and consumption in many ways, and economic activity remains tied to carbon emissions and wasteful consumption of energy and other natural resources. Major challenges ahead include climate change and the impact of environmental degradation on health and on future growth and development.
Robust policies and reliable information are needed to address these challenges, especially as growth resumes
Key findings
Air pollution continues to be a concern for the climate and for human health
● Greenhouse gas (GHG) emissions are growing worldwide but they have been declining in almost all OECD countries between 2000 and 2012, revealing an overall decoupling from economic growth. This is partly explained by the slowdown in economic activity following the economic crisis, but also by the strengthening of climate policies and changing pattern of energy consumption.
● OECD countries however emit far more carbon dioxide (CO2) per capita than most other world regions, with 9.6 tonnes per person compared with 3.4 tonnes per person in the rest of the world. With current policies, global emissions of CO2 are estimated to reach about three times more than what would be required to limit the long-term increase in
global temperatures to 2 °C.
● Sulphur oxide (SOX) and nitrogen oxide (NOX) emissions continue their downward trend as a result of energy savings, fuel substitution, pollution control and technical progress.
● In half of the OECD countries, over 90% of the population is exposed to concentrations of fine particulates (PM2.5) above which adverse health effects have been observed. These particulates penetrate deep in the lungs and may include heavy metals and toxic organic substances.
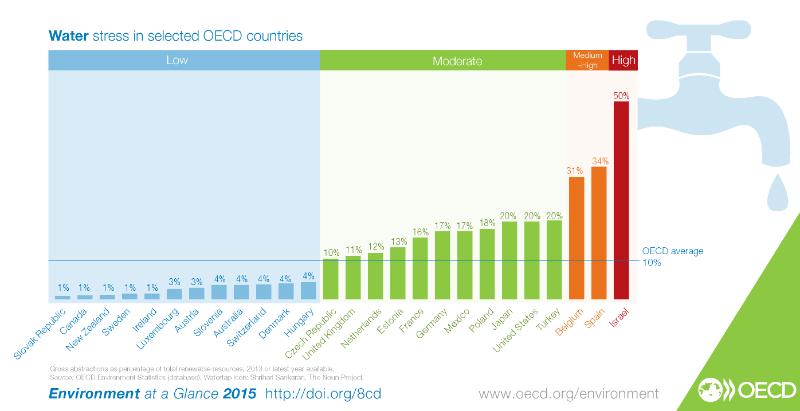
Water demand is increasing but water use remained stable
● Freshwater abstractions remained stable due to more efficient use and better pricing policies, but also to greater exploitation of alternative water sources such as re-used and desalinated water. While many countries show a relative decoupling of water abstractions from GDP growth, in a third of countries, freshwater resources are under medium to high stress, and many countries have to cope with local or seasonal water shortages. Climate change may further exacerbate such shortages, including in countries that benefit from a reliable water supply.
● Close to 80% of the population of OECD countries benefit from wastewater treatment. Several countries now face increasing costs to upgrade ageing water supply and sanitation networks. Some have to find other ways of serving small or isolated settlements and ensuring proper control of small independent treatment facilities.
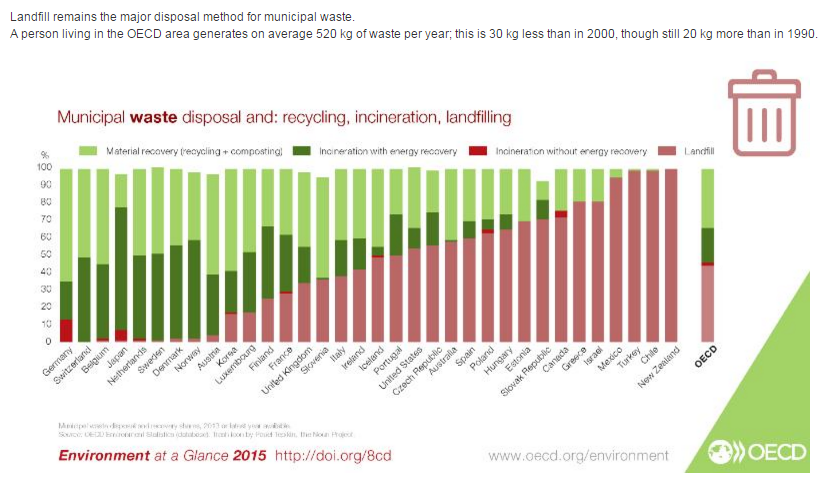
Landfill remains the major disposal method for municipal waste
● The generation of municipal waste slowed down in the 2000s. A person living in the OECD area generates on average 520 kg of waste per year; this is 30 kg less than in 2000, though still 20 kg more than in 1990. While waste is increasingly fed back into the economy through recycling, landfill remains the major disposal method in half of the OECD countries.
Threats to biodiversity are increasing
● Many animal and plant species in OECD countries are endangered, particularly in countries with a high population and infrastructure density. In North America and Europe, farmland and forest birds have declined by nearly 30% in 40 years. Many forests are threatened by degradation, fragmentation and conversion to other uses. Demand for wood to reach renewable energy targets plays a growing role in the exploitation of forests.
Environmental progress in economic sectors in uneven
● Energy intensity continued to improve over the 2000-14 period. Renewable energy is increasingly used, particularly in Europe. Renewables account for 21% of OECD electricity production (15.6% in 2000), and for almost 9% of total supply (6% in 2000). But fossil fuels still dominate supply (80%).
● In most OECD countries, road traffic growth rates exceeded economic growth. Countries’ efforts to promote cleaner vehicles are often offset by increases in vehicle stocks and traffic, resulting in additional fuel consumption and pollution.
● Farmland decreased in nearly all countries as did some agriculture-related GHG emissions and the use of phosphate fertilisers. However, the share of land under organic farming remains low, just above 2%, though this masks substantial variations across countries. The shares tend to be higher in the European Union, reaching 10% to 17% in some countries.
Support to research, development and innovation is growing
● Public R&D spending dedicated to environment grew by more than 20% since 2000, and recovered at a faster rate than total public R&D after the 2008 economic crisis. Its share in total public R&D spending represents however less than 2%. The share of spending on renewable energy in total energy spending increased from 8% to 24%.
● Official development aid (ODA) for environmental purposes continued to rise; its share in total ODA increased from 9.6% in 2002 to 12.6%, aid for renewable energy surpassed aid for non-renewables.
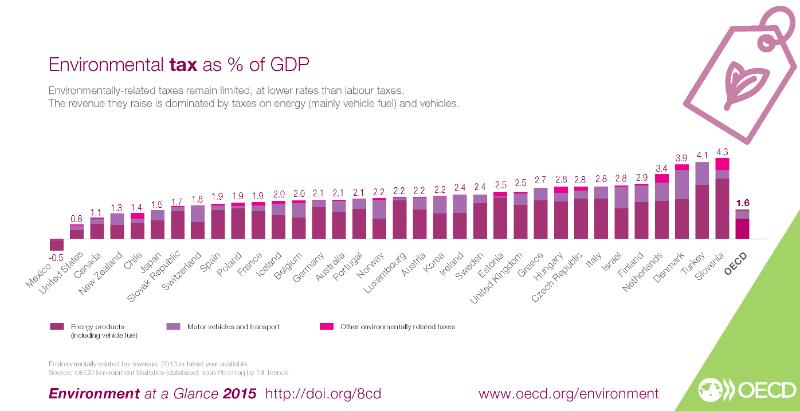
Implementing market instruments to price pollution remains difficult
● The use of environmentally related taxes is growing but remains limited compared to labour taxes. The revenue they raised represented about 1.6% of GDP in 2013. It is dominated by taxes on energy (69%) and on motor vehicles and transport (28%). Variations in energy tax rates, uneven price signals, low levels of taxation on fuels with high environmental impacts, and exemptions for fuel used in some sectors impede the transition to a low-carbon economy. Many countries still apply higher taxes for petrol than for diesel, and the share of taxes in end-use prices is generally higher for households than for industry.