Previous Story
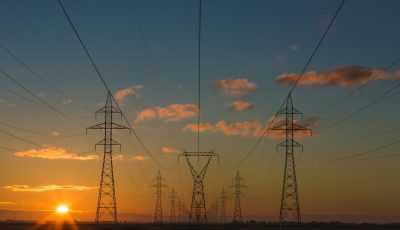
The Race for Clean Energy
Last year, on a global basis, more net power generating capacity was added through renewable sources than via all other power sources combined.
Which countries are leading this charge, and what power sources are being adopted the fastest?
Today’s infographic comes to us Raconteur, and it breaks down various metrics around energy investment. The graphic looks at absolute and per capita power consumption by countries, as well as dollars being invested into each particular type of green energy.
COUNTRY COMPARISONS
The two countries that lead the pack in absolute terms are China and the United States. In 2016, China consumed the equivalent of 349.2 million tonnes of oil in renewable energy, while the U.S. was at 143 million tonnes.
However, these numbers are very skewed by the large populations of these countries. In percentage terms, China only gets 11.4% of its primary energy from renewables, while the U.S. gets 6.3% of its mix from sources like solar and wind.
On a per capita basis, major economies leading the world include countries like Norway, Canada, Sweden, Brazil, and Austria – all of these countries get about 30% or more of their primary energy from renewables. That said, it is also worth noting that hydropower makes up a large degree of the energy mixes for many of these places.
CLEAN INVESTMENTS
2016 was a landmark year for clean energy, with net power capacity additions for renewables topping the list:
| Power Type | Net Global Capacity Added (2016) |
|---|---|
| Renewable (excl. large hydro) | 138 GW |
| Coal | 54 GW |
| Gas | 37 GW |
| Large hydro | 15 GW |
| Nuclear | 10 GW |
| Other flexible capacity | 5 GW |
Importantly, more green power is being added at lower costs. Below, you can see that the level of investment is actually falling, as utilities get more “bang for the buck” on new capacity added.
Here is the overall investment for each renewable category in 2016:
| Renewable source | Global New Investment (Billions) | Change |
|---|---|---|
| Solar | $113.7 | -34% |
| Wind | $112.5 | -9% |
| Large hydro | $23.2 | -48% |
| Biomass & waste-to-energy | $6.8 | 0% |
| Small hydro | $3.5 | 0% |
| Geothermal | $2.7 | -37% |
| Biofuels | $2.2 | 17% |
| Marine | $0.2 | -7% |
In 2016, investment in clean energy fell by 18% – however, 138 GW of new power capacity came online from renewable sources (excl. large hydro), which is 11 GW more than in the previous year.
If costs continue to fall, it will mean more accessible clean energy for any country that wants it – and cost efficiency will also make the race to add capacity via renewables much more meaningful and sustainable in the long term.

Courtesy of: Visual Capitalist